A Statistical Analysis of the Impact of the Transition to Online Tournaments in Lincoln-Douglas
Sachin Shah
January 29, 2021
Introduction
The COVID-19 pandemic has shifted the way Lincoln-Douglas tournaments operate. Instead of traveling to in-person tournaments, prepping in school cafeterias, or packing into elimination rooms, students debate over Zoom as tournaments are now hosted online. Online debate has brought about many logistical changes to the Lincoln-Douglas scene such as virtual flips and tech checks. Some like these online tournaments citing reduced participation costs, while others prefer in person tournaments due to the social atmosphere. Whether or not you think online debate is for the better, it is undeniable this has been a significant change. This season presents a unique opportunity to analyze the impact of the transition to online tournaments for Lincoln-Douglas debate. We will examine debater participation rates, judge participation, sit rates, speaker points, and of course, side bias.
Data
The data analyzed is comprised of round data from August 2015 – present. Varsity round results from bid-distributing tournaments and the Tournament of Champions each season were gathered from tabroom.com. This large dataset notably includes:
- 6 seasons
- 18 topics
- 238 tournaments
- 71,282 rounds
Debater Participation
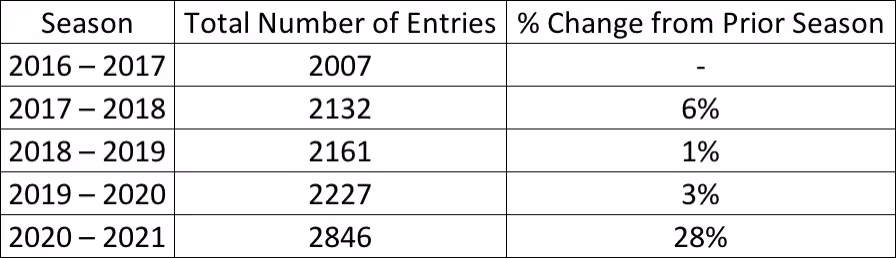
Many have speculated that online debate would dramatically increase participation in the activity. We can compare the total number of varsity entries in each September-October and November-December tournament across multiple seasons. In the table below, there was a 28% increase in the number of entries this season (Table 1).
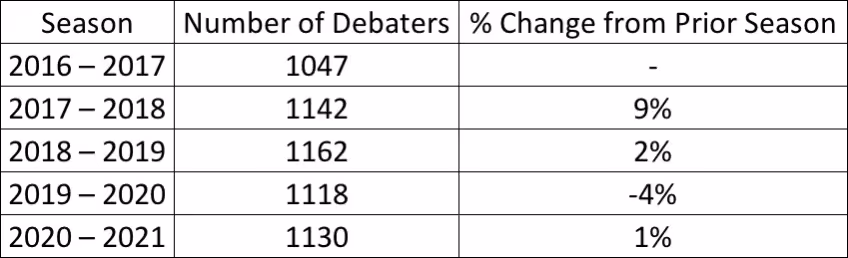
However, the overall number of unique debaters on the circuit has increased roughly in line with the activity’s growth for the last few years. This indicates online debate has not yet led to new varsity competitors, but instead has allowed debaters to compete more often (Table 2). Indeed, the average number tournaments a given debater attends a season has increased to 2.5 from 2 last season.
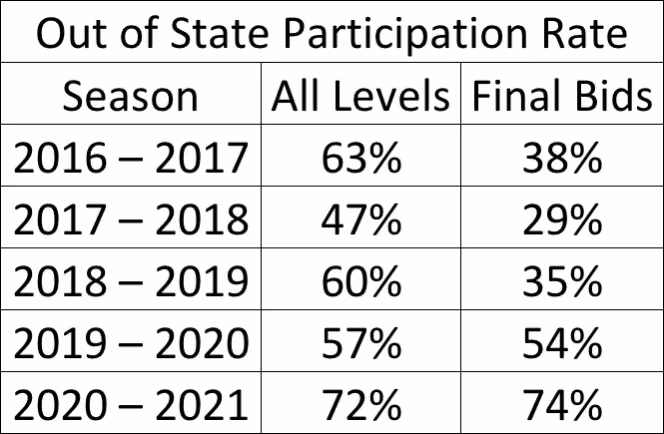
A driving force behind this increase likely is the reduced cost of attending out-of-state tournaments. This season had a jump in out-of-state participation on the September-October and November-December topics (Table 3). This can be seen most dramatically with final bid tournaments. When the cost of in-person attendance is high, debaters tend to opt for larger octofinal bid tournaments; remotely competing makes attending finals bids more attractive due to a lesser financial cost. This season witnessed a significant jump in the proportion of out-of-state competitors from historical levels.
This analysis does not exclude the possibility that novice and JV divisions may have expanded as a result of the move to online. In that case, the expansion will not be reflected in the varsity pool for another one to three years. As it stands today, there has not been a marked increase in the number of varsity debaters as a result of online debate.
Judge Participation
Continuing the discussion of participation in online debate, we can investigate if more people are able to judge. An intriguing and unique aspect of Lincoln-Douglas debate is the large range of judging ideologies represented by individual judges, where no two judges judge exactly the same. The existence of mutual judging preferences allows each of these judges to appeal to a different type of debater. I'm sure every debater sees new names on pref sheets regardless of the tournaments they go to – I know I did. With online tournaments, even more new names may appear.
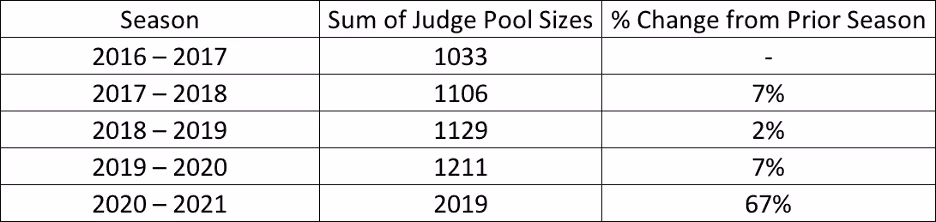
The no-travel necessary for online tournaments should theoretically lower the barrier for people to judge. I can be in Maine and judge a California tournament without a problem (even with time differences). Empirically, we see the sum of the total number of judges at each September-October and November-December tournaments has dramatically increased this season (Table 4). The judge pool increased even more than what was required by the larger entry pools seen with online debate.
Additionally, there have been 614 new judges just on this season's September-October and November-December topics[1]. In contrast, for the past 3 seasons (2017 – 2020), an average of 423 new judges entered the pool during the first two topics. This season is adding new judges at an above average rate so far. One promising consequence of this initial increase of new judges might be that these new judges might eventually develop into more coaches in the community, which may increase coaching accessibility for individuals who do not have access to large programs.
Sit Rates
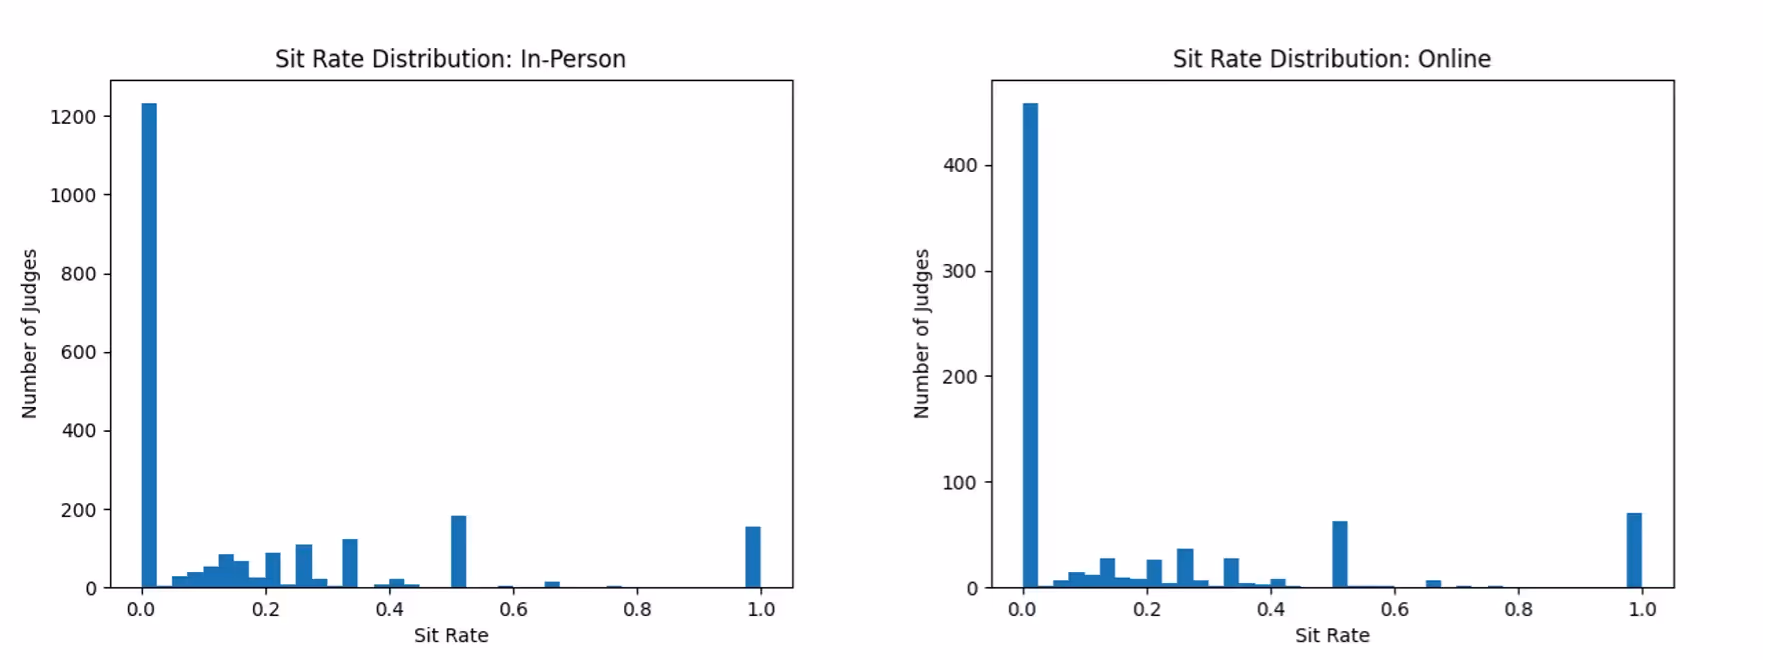
One concern some have raised with online debate is the occurrence of tech issues. A judge having connection issues in the middle of the 1ar, for instance, can drastically affect the decision. It would be expected that the sit rate[2] would increase if judges miss critical portions of speeches, but this is empirically not the case. On average, a judge sat 18% during in-person tournaments and 19% in online tournaments (Figure 1). So, a judge will sit roughly once every five rounds regardless of whether judging in-person or online. We can confirm the distribution of sit rates between in-person and online tournaments is similar with a Kolmogorov-Smirnov test (p-value = 0.678).
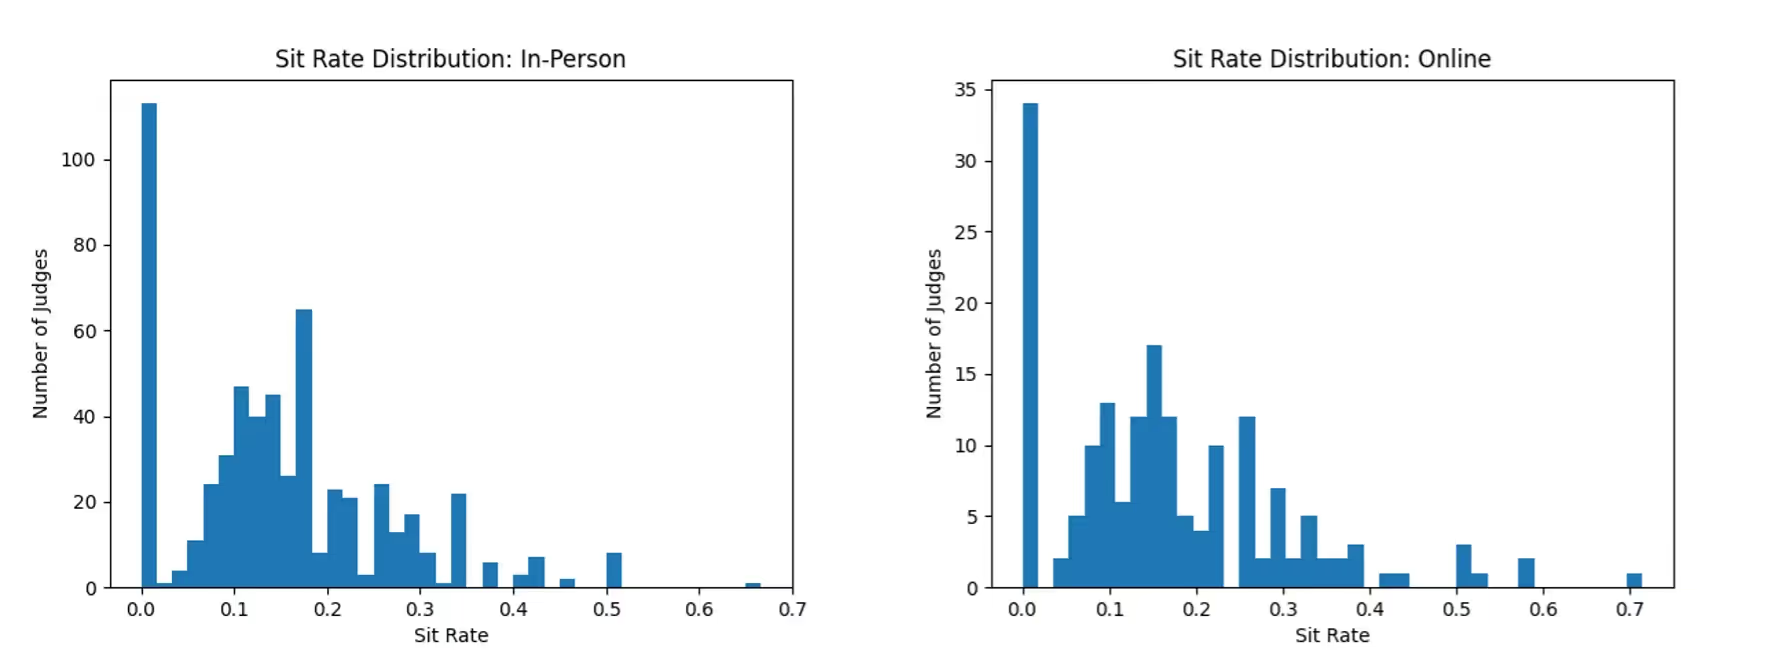
This analysis might be affected by the data including rounds for those who only judge a few elimination rounds. Usually sitting occurs when there is an unexpected panel or a messy round. If someone only judges a few times, they have a smaller likelihood of being in one of those scenarios than those who judge frequently. To account for this, let’s consider the sit rate of only those who have judged at least six elimination rounds[3]. Narrowing the data set will increase our confidence in their sit rate (Figure 2). Using this threshold, in person tournaments had an average sit rate of 15% while online tournaments had 16%. The two distributions are indeed similar (K-S test p-value = 0.521). This shows a judge will likely sit once every six rounds, and online debate has not affected this aspect of debate.
Speaker Points [4]
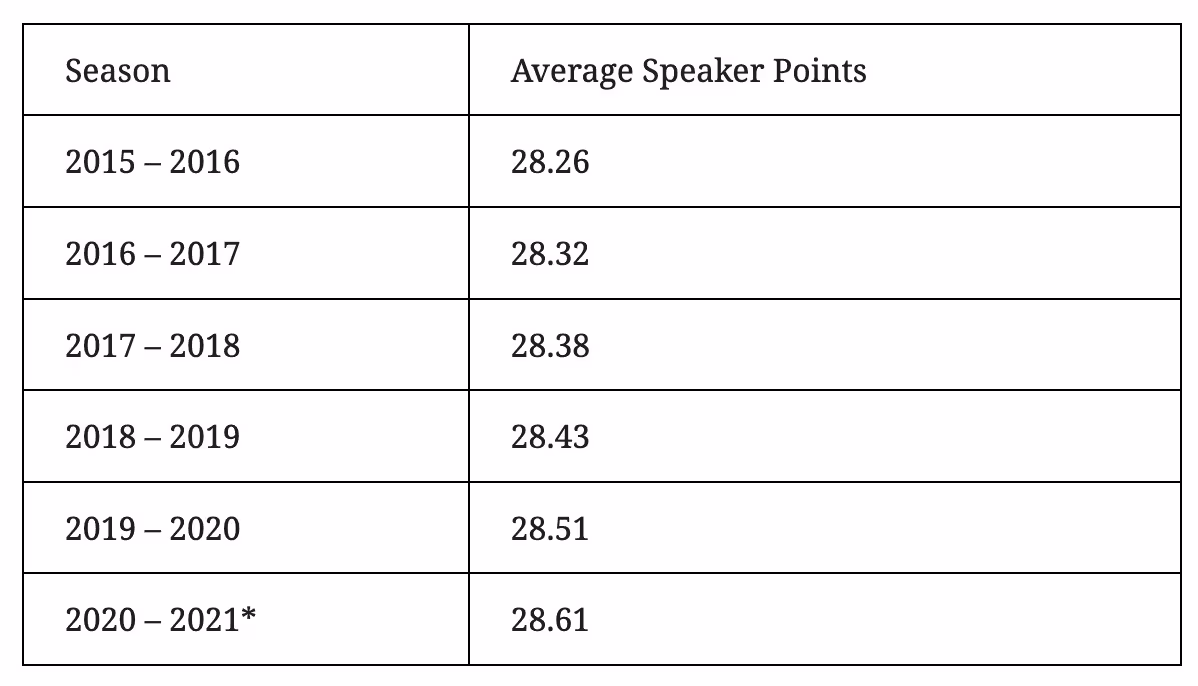
Another aspect of debate that might be affected by tech issues is speaker points. Some judges might inflate speaker points given online difficulties, or alternatively deflate speaker points due to lower speech clarity. For the past few years, the speaker point average has been increasing (roughly 0.07 points each season). A significant positive linear regression was found (p-value < 10^-4 ), with an R^2 of 0.99. The data reflects an increase in speaker points this year roughly in line with the historical trend (Table 5).
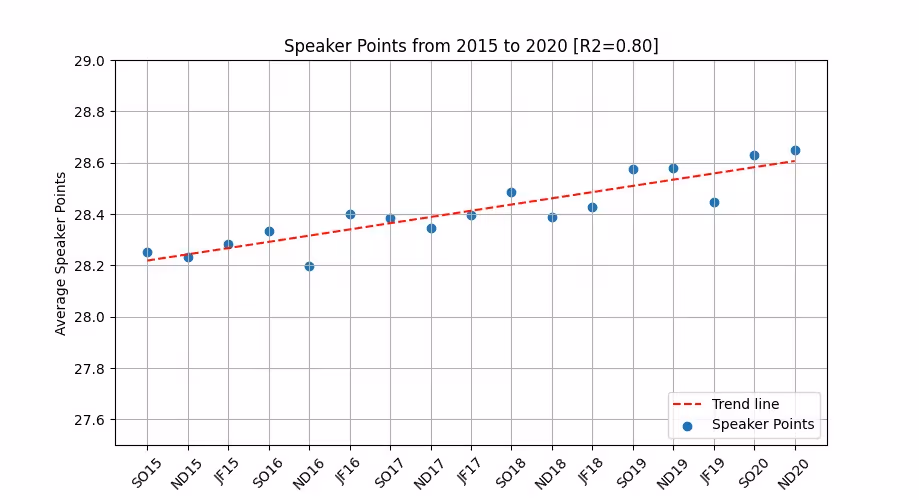
This analysis may change as the 2020 – 2021 season continues. For increased granularity, we can also examine the trend in average speaker points per each topic, rather than full season. We indeed notice a steady climb in speaks throughout the year. A significant positive linear regression was found for every topic time period since the 2015 season through the past 2020 November-December topic (p-value < 10^-5), with an R^2 of 0.80 (Figure 3).
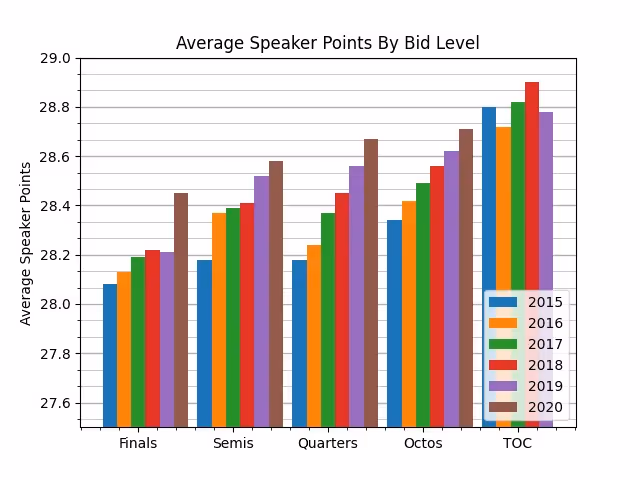
We could further segment the data by looking at speaker points by bid level. Average speaks can be used as a proxy for overall competitiveness of a tournament. The Tournament of Champions consistently has the highest speaker point average. Final bids had a large jump from previous seasons, suggesting these tournaments were much more competitive this year.
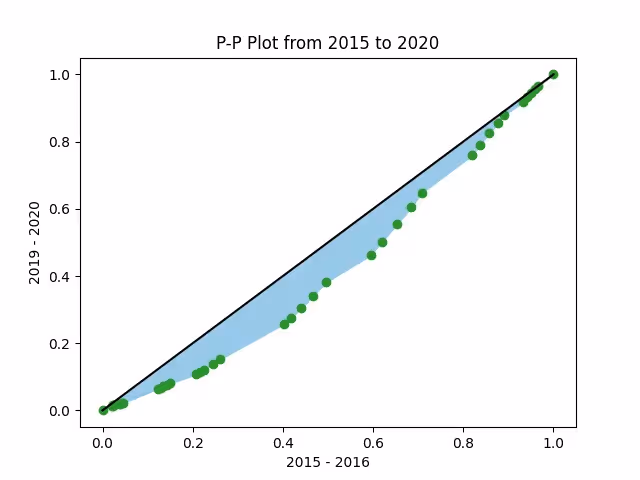
A simple conclusion we could draw from the data is that bid distributing tournaments are experiencing speaker point inflation in line with the historical trend of the average increasing from year-to-year / topic-to-topic. Probability-probability plots (P-P plot) will provide a more specific account of the speaker point inflation.
As more debaters gain access to resources like prep, camp, and coaching, we would expect there would simply be more debaters earning “high” speaker points, and thus the distribution of speaker points may shift to higher ranges over time. This plot demonstrates where the speaker point distribution is shifting (Figure 5). This confirms that the middle tier of speaker points is decreasing in favor of the higher tier. There has not been a shift from high speaks in 2015 – 2016 to even higher speaks in 2019 – 2020. A Kolmogorov-Smirnov test indicates that the speaker point distribution during the 2015 – 2016 season was greater than the speaker point distribution during the 2019 – 2020 season (p-value < 10^-190), meaning there were more “low” speaker points assigned in 2015 – 2016 than in 2019 – 2020.
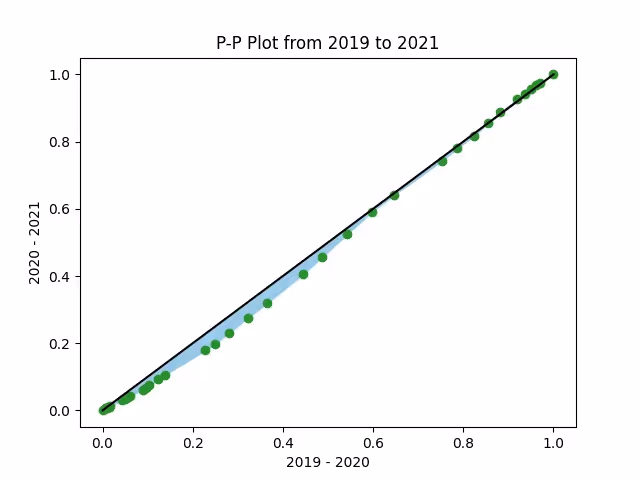
Comparing the first two topics of 2019 to the first two topics of 2020 demonstrates the effect online debate on speaker point inflation (Figure 6). The median did increase (K-S test p-value < 10^-15), but it’s within reason given the historical data.
Side Bias
Side bias statistics can only be extrapolated to future tournaments if there hasn't been a structural change in debate. Any substantial change (such as the 1ar getting 5 minutes) would mean the prior empirical data may not accurately reflect the current era of debate, and any attempt to extrapolate prior data to a new era is misguided. Online debate is a sufficient structural change to the activity to warrant updating side bias statistics to explore if there is a bias in the current online form of debate.
Our dataset will include bid tournaments from 2020 Tournament of Champions (held online) to Present (43 tournaments in total)[5]. Of the 12,504 rounds, the negative won 52.61% of rounds (p-value < 10^-8, 99% confidence interval [51.46%, 53.76%]), which is consistent with past in-person tournaments[6].
Although this sample is representative of “varsity Lincoln-Douglas” debate, it might not be representative of “competitive” debates due to the novice effect. Those just starting out or participating casually could skew the data because as a group they might excel on one side than the other. One solution would be to only look at elimination rounds as the participants in these rounds are likely more apt at debating successfully on both sides. If there is a structural skew in favor of the negative, we would expect the side bias to be larger in elimination rounds. In fact, of online elimination rounds, the negative won a significant 56.03% of rounds (p-value < 10^-4, 99% confidence interval [52.22%, 59.84%]). Online tournaments have not made affirming any easier than in-person tournaments.
It is also interesting to look at the trend over multiple topics. Of the 238 bid distributing tournaments from August 2015 to present[7], the negative won 52.32% of rounds (p-value < 10^-30, 99% confidence interval [51.84%, 52.81%]). Of elimination rounds, the negative won 55.79% of rounds (p-value < 10^-15, 99% confidence interval [54.08%, 57.50%]). This continues to suggest the bias might be structural and not topic specific as this analysis now includes 18 topics.
Although there are other factors that can influence if the affirmative debater or the negative debater is more likely to win in a given round (such as skill level), the negative almost certainly retains an advantage in competitive Lincoln-Douglas debate. Given this advantage, the affirmative may be justified in being granted a substantive advantage to compensate for the structural skew. This could take various forms such as granting the affirmative presumption ground, tiny plans, or framework choice. Whatever form chosen should be tested to ensure the skew is not unintentionally flipped.
Conclusion
The community has seen debaters competing more often and more new judges entering the pool as a result of the transition to online debate. In spite of these changes, many aspects of Lincoln-Douglas debate have remained the same: affirming is still harder, speaker points are inflating at the same rate, and judges sit just as often as before. It will be interesting to see how online debate affects the Lincoln-Douglas event as the community continues adjusting.
------------
[1] This is calculated by the number of unique names that judged a round.
[2] Sitting refers to the dissenting vote on a panel of judges. For example, if A, B, and C are on a panel and it is a ‘2-1’ for the affirmative, where A and B voted affirmative and C voted negative, we would say C “sat”.
[3] One may note this is an arbitrary threshold. A high threshold will have too small of a sample size and a low threshold will be skewed to due to low samples per judge. Changing the threshold retains the same sit rate of approximately 15%
[4] Carding this section of the article for the purpose of getting higher speaks would be misrepresenting the author’s intent.
[5] Alta, Apple Valley, Arizona State University, Arthur School, Blake, Bronx Science, College Prep, Cypress Bay, Dowling Catholic, Duke, Durham Academy, Florida Blue Key, Glenbrooks, Grapevine, Greenhill, Harvard-Westlake, Heritage Hall, Holy Cross, Isidore Newman, Lewis Clark, Lexington, Long Beach, Loyola, Meadows, Middleton, Myers Park, Newark, North Allegheny, Notre Dame, Presentation, Princeton, Ridge, Scarsdale, Seattle Academy, Strake Jesuit, Sunvitational, TOC, University of Houston, University of Kentucky, University of Texas, Valley, Winston Churchill, Yale.
[6] All p-values calculated in this section utilize a 1 proportion z-test. The null hypothesis was set to (where is the proportion of negative wins). The alternative hypothesis was set to p = 0.5 (where p is the proportion of negative wins). The alternative hypothesis was set to p > 0.5.
[7] 2015 - 2016: Apple Valley, Beltway, Berkeley, Blake, Bronx Science, Colleyville Heritage, Emory, Glenbrooks, Golden Desert, Grapevine, Greenhill, Harvard, Holy Cross, Lexington, Meadows, Middleton, Newark, Notre Dame, Princeton, Scarsdale, St Marks, Stanford, Strake Jesuit, TOC, University of Texas, Yale. 2016 - 2017: Alta, Apple Valley, Beltway, Berkeley, Blake, Bronx Science, Colleyville Heritage, Columbia, Emory, Glenbrooks, Grapevine, Greenhill, Holy Cross, Isidore Newman, Lexington, Loyola, Meadows, Middleton, Millard North, Newark, Notre Dame, Presentation, Princeton, Scarsdale, St Marks, Stanford, Strake Jesuit, TOC, University of Houston, University of Pennsylvania, University of Puget Sound, Valley, Wake Forest, Yale. 2017 - 2018: Apple Valley, Arizona State University, Beltway, Blake, Bronx Science, CSU Long Beach, Central Valley, Colleyville Heritage, Columbia, Crestian Tradition, Dowling Catholic, Emory, Glenbrooks, Golden Desert, Grapevine, Greenhill, Harvard, Holy Cross, Isidore Newman, Lexington, Loyola, Meadows, Middleton, Millard North, Peninsula, Presentation, Ridge, Saint James, Scarsdale, St Marks, Stanford, Strake Jesuit, TOC, University of Houston, University of Kentucky, University of Pennsylvania, University of Puget Sound, University of Southern California, University of Texas, Valley, Winston Churchill, Yale. 2018 - 2019: Alta, Apple Valley, Arizona State University, Blake, Bronx Science, CSU Long Beach, College Prep, Colleyville Heritage, Columbia, Cypress Bay, Dowling Catholic, Durham Academy, Emory, Glenbrooks, Golden Desert, Grapevine, Greenhill, Harvard, Harvard-Westlake, Heritage Hall, Holy Cross, Isidore Newman, Lewis Clark, Lexington, Loyola, Meadows, Middleton, Millard North, Newark, Peninsula, Princeton, Ridge, Scarsdale, St Marks, Stanford, Strake Jesuit, TOC, University of Houston, University of Kentucky, University of Pennsylvania, University of Puget Sound, University of Southern California, University of Texas, Valley, Winston Churchill, Yale. 2019 - 2020: Apple Valley, Arizona State University, Berkeley, Bethel Park, Blake, Bronx Science, College Prep, Colleyville Heritage, Columbia, Cypress Bay, Dowling Catholic, Durham Academy, Emory, Florida Blue Key, Glenbrooks, Golden Desert, Grapevine, Greenhill, Harvard, Harvard-Westlake, Holy Cross, Isidore Newman, Lewis Clark, Lexington, Long Beach, Loyola, Meadows, Middleton, Millard North, Myers Park, Newark, Peninsula, Presentation, Princeton, Ridge, Scarsdale, St Marks, Stanford, Strake Jesuit, Sunvitational, TOC, University of Houston, University of Kentucky, University of Pennsylvania, University of Puget Sound, University of Texas, Valley, Yale. 2020 - 2021: Alta, Apple Valley, Arizona State University, Arthur School, Blake, Bronx Science, College Prep, Cypress Bay, Dowling Catholic, Duke, Durham Academy, Florida Blue Key, Glenbrooks, Grapevine, Greenhill, Harvard-Westlake, Heritage Hall, Holy Cross, Isidore Newman, Lewis Clark, Lexington, Long Beach, Loyola, Meadows, Middleton, Myers Park, Newark, North Allegheny, Notre Dame, Presentation, Princeton, Ridge, Scarsdale, Seattle Academy, Strake Jesuit, Sunvitational, University of Houston, University of Kentucky, University of Texas, Valley, Winston Churchill, Yale